

Biology, 05.05.2020 18:12, jaemitchell23
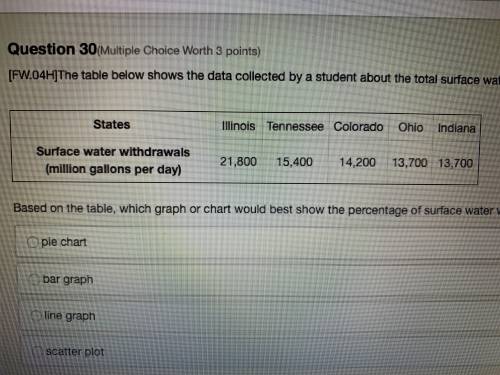
The table below shows the data collected by a student about the total surface water withdrawn from five different states in the year 2000. Based on the table, which graph or chart would best show the percentage of surface water withdrawal by the five states? (not biology i didn’t know what else to choose)

Answers: 2


Other questions on the subject: Biology
Biology, 22.06.2019 09:30, mckeeshallea400
Drag each tile to the correct box. the body monitors the levels of oxygen in the blood to regulate breathing. isabel is running in a marathon and is near the finish line. she feels out of breath. how will her nervous system work to generate a reaction? arrange the tiles in chronological order. isabel's breathing rate increases. sensory receptors in the arteries detect low oxygen levels. the brain sends signals through motor neurons. sensory neurons generate an impulse. the central nervous system relays an impulse to certain brain regions.
Answers: 1
Do you know the correct answer?
The table below shows the data collected by a student about the total surface water withdrawn from f...
Questions in other subjects:


Mathematics, 22.10.2020 03:01

Mathematics, 22.10.2020 03:01


