

Biology, 05.04.2020 20:19, ethancarter560
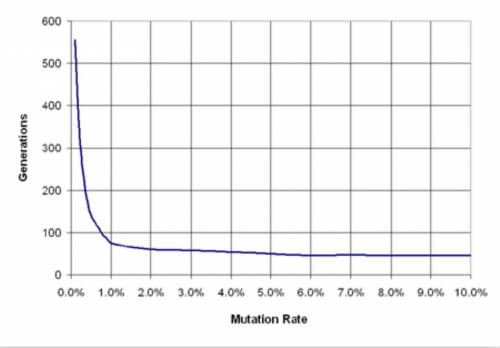
A scientist used radiation to change the mutation rates of a population of bugs. He then measured how many generations it took for bugs with different mutation rates to adapt to a new background by natural selection. On the graph below, the x-axis represents the mutation rate, and the y-axis represents the number of generations it took for the bugs to reach an average fitness of 90%. Which of the following statements is most accurate?
A. Adaptation occurred most quickly when the mutation rate was lowest.
B. Adaptation occurred more quickly as the mutation rate increased. However, this effect was relatively small for mutation rates above 1%.
C. Adaptation occurred twice as quickly when the mutation rate was 10% as when the mutation rate was 5%.
D. There is no relationship between the mutation rate and how quickly adaptation occurred.

Answers: 3


Other questions on the subject: Biology
Biology, 21.06.2019 15:10, lakinbacon4
Use this diagram of an animal cell to answer the question. where does the first stage of cellular respiration occur? w x y z
Answers: 1
Biology, 22.06.2019 06:10, thompsonhomes1
The normal shape of an enzyme is as shown in structure a. if the enzyme’s shape changes to that shown in structure b, what are two consequences of this change?
Answers: 1
Do you know the correct answer?
A scientist used radiation to change the mutation rates of a population of bugs. He then measured ho...
Questions in other subjects:

Mathematics, 26.01.2021 14:00

Chemistry, 26.01.2021 14:00

Mathematics, 26.01.2021 14:00
Mathematics, 26.01.2021 14:00
Mathematics, 26.01.2021 14:00
Biology, 26.01.2021 14:00

Physics, 26.01.2021 14:00


