


populations of herbivores in a grassy field.

Biology, 17.03.2020 22:03, katelynalivia
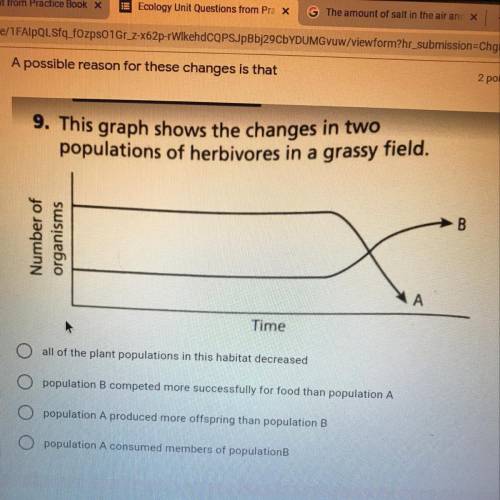
9. This graph shows the changes in two
populations of herbivores in a grassy field.
A:all of the plant populations in this habitat decreased
B:population B competed more successfully for food than population A
C:
population A produced more offspring than population B
D:
population A consumed members of population

Answers: 1
Other questions on the subject: Biology
Biology, 22.06.2019 02:30, briizy
Plz ! for many generations farmers in north america have been choosing to cross corn plants with large ears of corn each year this results in the new generation of plants also growing large ears of corn. what is the technique called? a. selective breeding. b. natural selection. c. mitosis. d. asexual budding.
Answers: 1
Biology, 22.06.2019 04:00, ashleyprescot05
What best explains the inability for life to exist in earth early atmosphere
Answers: 1
Biology, 22.06.2019 07:00, kprincess16r
Give three examples of plant activities that are affected by circadian rhythms and natural fluctuations in the length of daylight?
Answers: 1
Biology, 22.06.2019 16:20, kdenormandie3122
What contributes to the high level of biodiversity found in wetlands? a. the large amount of available organic matter to organisms that are food for larger organisms b. the amount of available water for organism use c. the high nutrient availability d. all of the above select the best answer from the choices provided a b c d
Answers: 2
Do you know the correct answer?
9. This graph shows the changes in two
populations of herbivores in a grassy field.
populations of herbivores in a grassy field.
Questions in other subjects:

Biology, 01.04.2020 20:22


