


Ageochart is a tool used to visualize data on a map. the size of the circular
marker indicates...

Biology, 12.01.2020 05:31, annapittbull12
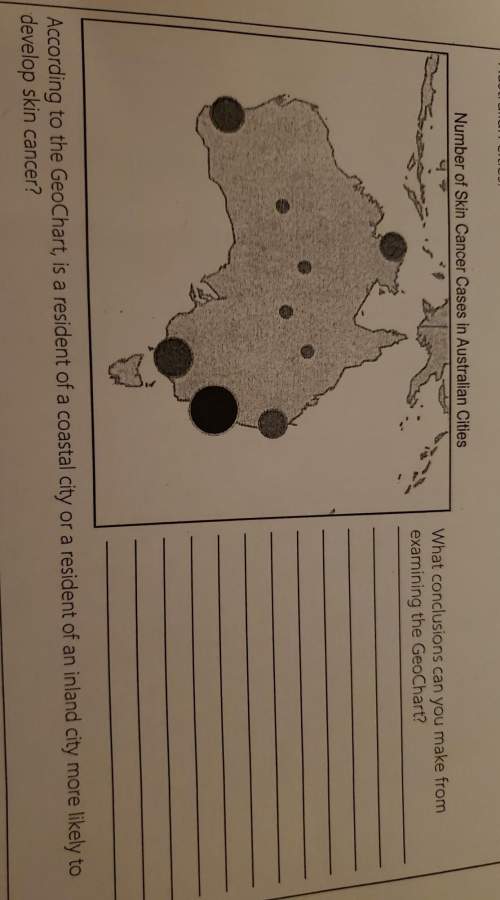
Ageochart is a tool used to visualize data on a map. the size of the circular
marker indicates a value. large circles correspond to large amounts and small
circles to small amounts.
this geochart tracks the number of cases of skin cancer diagnosed per year in 9
australian cities.
number of skin cancer cases in australian cities.
❗answer the questions on the picture❗

Answers: 1
Other questions on the subject: Biology
Biology, 22.06.2019 01:00, meandmycousinmagic
Which of the following is not a symptom of desertification? a) decrease in salt content of the soil b) lowering of the water table c) reduced surface water d) increased soil erosion e) loss of native vegetation
Answers: 1
Biology, 22.06.2019 04:30, jesse7412
The picture showed normal blood cells which are around and sickle cells which appear much longer people with sickle-cell suffer from the sickle cell anemia which is inherited diseaseit is caused by a change in gene responsible for production of hemo goblin this type of change is known as an
Answers: 2
Do you know the correct answer?
Questions in other subjects:

Mathematics, 29.06.2021 18:20


English, 29.06.2021 18:20
Mathematics, 29.06.2021 18:20


