

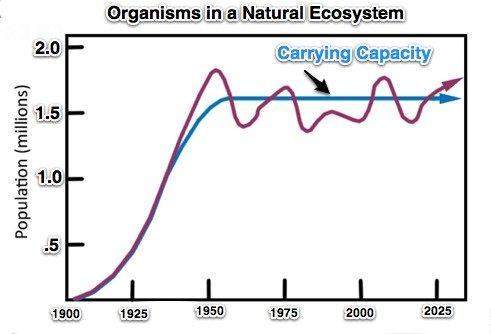
The graph represents a typical carrying capacity graph, or the maximum population size a certain environment can support for an extended period of time, for particular species. under ideal conditions, a population naturally increases until it overshoots the carrying capacity. at this point, the environment can no longer provide for the species, due to a number of different environmental resistances. the population, due to lack of resources, will begin to die out, allowing the environment to recover.
based on the trends of the carrying capacity graph, what is the predicted population of organisms, in millions, in 1950?
a) 1.25 million
b) 1.75 million
c) 2.0 million
d) 3.0 million

Answers: 1


Other questions on the subject: Biology
Biology, 22.06.2019 00:00, eylinglez3ovm16v
Will someone me with this.. specialized cells which perform a particular function form: tissues organs or organism
Answers: 2
Biology, 22.06.2019 04:30, brianna1096
Quick asap will give brainiest ! what best describes the same pattern of tides on earth throughout the day? neap tides spring tides semidiurnal tides nocturnal tides
Answers: 1
Biology, 22.06.2019 06:30, jadalysrodriguez
Photosynthesis uses co2 and cellular respiration produces co2. we call the point when the two processes are in balance--when there is no net production of co2--the compensation point. how might you limit one of the processes in order to achieve a compensation point?
Answers: 3
Biology, 22.06.2019 17:50, gennhill14
To take a whiff of your favorite food, you use both? a. motor nerves and your digestive system b. sensory nerves and your immune system c. motor nerves and your skeletal system d. sensory nerves and your respiratory system
Answers: 2
Do you know the correct answer?
The graph represents a typical carrying capacity graph, or the maximum population size a certain env...
Questions in other subjects:

History, 19.07.2019 23:40

English, 19.07.2019 23:40

Computers and Technology, 19.07.2019 23:40

Chemistry, 19.07.2019 23:40

Mathematics, 19.07.2019 23:40
Mathematics, 19.07.2019 23:40

Spanish, 19.07.2019 23:40
Mathematics, 19.07.2019 23:40


