


Plato users! !
this graph gives information on changes in sea ice extent in the arctic...

Biology, 09.10.2019 16:50, izzythe5th
Plato users! !
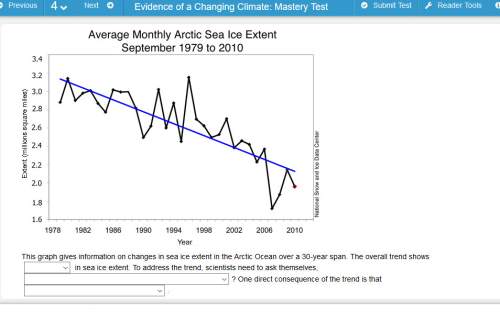
this graph gives information on changes in sea ice extent in the arctic ocean over a 30-year span. the overall trend shows in sea ice extent. to address the trend, scientists need to ask themselves ? one direct consequence of the trend is that .
blank 1:
a decline
a rise
no change
blank 2:
what happens to polar animals when sea ice melts
how did global rainfall amounts change during the same period
why is sea ice melting so much and so fast
what were the levels of sea ice extent from 1948 to 1978
blank 3:
ocean salinity will decrease
arctic regions will cool
worldwide rainfall amounts will drop
sea ice will emerge in temperature climates

Answers: 3
Other questions on the subject: Biology
Biology, 22.06.2019 03:30, Damagingawsomeness2
For this question look at the hydropic diagram water that is heated by the sun evaporates. select the number that represents it.
Answers: 1
Biology, 22.06.2019 09:00, ittmanny6138
Recommend a strategy for incorporating sustainable human activity into a tropical rain forest biome.
Answers: 1
Biology, 22.06.2019 12:00, swaggernas
Abody cell has been growing and at synthesis proteins. in the nucleus of this body cell, dna replication is taking place. and a copy of the cells genetic material is copied. which of the following is the best conclusion you can make about the life cycle of this cell ? a) the cell is ready to undergo mitosis. and a chemical signal will send the cell to prophase b)the cell is undergoing meiosis and will cross over the genetic material next c)the cell is in the s phase of interphase and will move next to the g2 phase d) the cell is in the g2 phase of the interphase and is ready to begin diving
Answers: 1
Do you know the correct answer?
Questions in other subjects:


Biology, 16.03.2020 17:28


